Graph View Pane
Instructions and tips on using the Graph View pane to visualize tracking data.
Overview
The Graph View pane allows you to visualize and monitor multiple data channels, in both Live and Edit mode.
In Live Mode, the following data can be plotted in real-time:
Rigid body 6 DoF data (Position and Orientation)
IMU data (Orientation)
Force Plate Data (Force and Moment)
Analog Data
Telemetry Data
In Edit Mode, graphs are used to review and post-process the captured data. In addition to the graphs available in Live mode, edit mode includes the ability to graph 3D positions of reconstructed markers.
In addition to the standard graph layouts (channel, combined, tracked), the user can create custom layouts to monitor specific data channels only. Motive allows up to 9 graphs plotted in each layout and up to two graph view panes to be opened simultaneously.
Pane Layout
To open a Graph View pane, click either the ![]() or the
or the ![]() icon on the main toolbar, or select Graph 1 or Graph 2 from the View menu.
icon on the main toolbar, or select Graph 1 or Graph 2 from the View menu.
Select a marker, bone, or asset in the 3D Viewport to display its data on the graph.
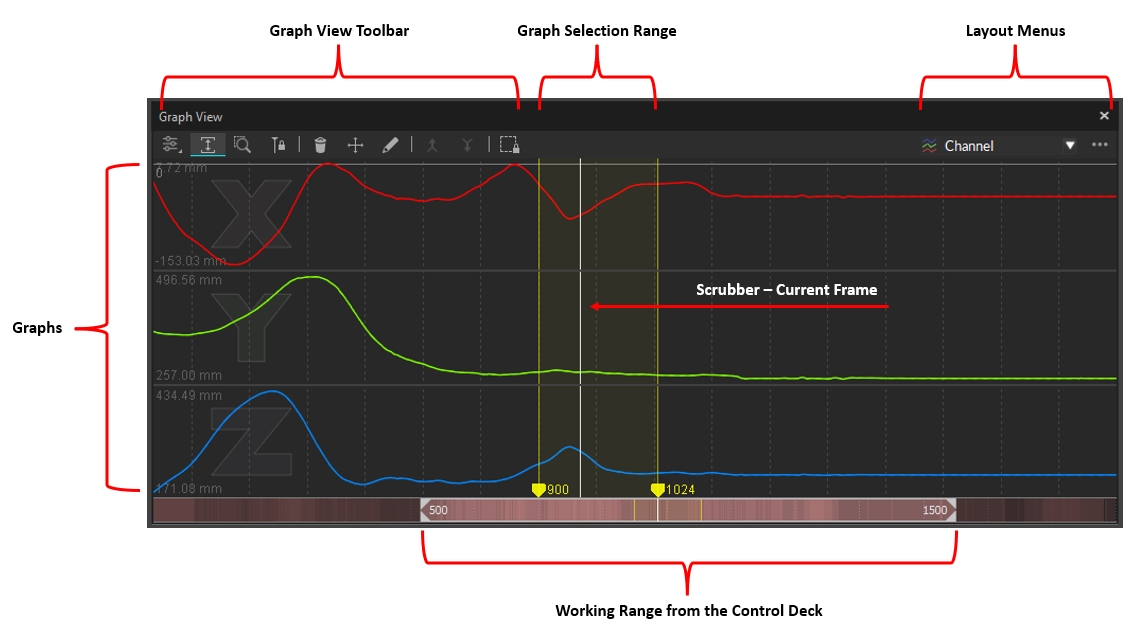
Toolbar
![]()
Graph Editor
Opens the Data and Visuals sidebar to customize a selected graph within a layout.
![]()
Auto Extents
Toggle to autoscale X/Y/Z graphs.
![]()
Zoom Fit
(selected range)
Zooms into selected frame region and centers the timeline accordingly.
![]()
Lock Cursor Centered
Locks the timeline scrubber at the center of the view range.
![]()
Delete Selected Keys
Deletes the selected frame region.
![]()
Move Selected Keys
Translates trajectories in selected frame region. Select a range and drag up and down on a trajectory.
![]()
Draw Keys
Manually draw trajectory by clicking and dragging a selected trajectory in the Editor.
![]()
Merge Keys Up
Merges two trajectories together. This feature is useful when used with the Tracks View graphs. Select two trajectories and click this button to merge the bottom trajectory into the top trajectory.
![]()
Merge Keys Down
Merges two trajectories together. This feature is useful when used with the Tracks View graphs. Select two trajectories and click this button to merge the top trajectory into the bottom trajectory.
![]()
Lock Selection
Locks the current selection (marker, Rigid Body, Skeleton, force plates, or NI-DAQ) onto all graphs on the layout. This is used to temporarily hold the selections.
![]()
Select Layout
Displays the name of the system or user defined Layout currently in use. When clicked, opens the Layout menu.
![]()
Context Menu
Opens the Pane Options menu.
Pane Options Menu
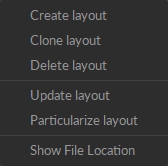
Click the ![]() context menu button in the top right corner of the Graph View pane to select layout options.
context menu button in the top right corner of the Graph View pane to select layout options.
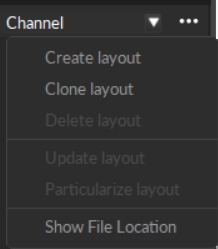
Create Layout
Creates a new graph layout.
Clone Layout
Creates a new graph layout based on the current layout.
Delete Layout
Deletes the current graph layout.
Update Layout
Saves the changes to the graph layout XML file.
Particularize Layout
Takes an XML snapshot of the current graph layout. Once a layout has been particularized, both the layout configuration and the item selection will be fixed and it can be exported and imported onto different sessions.
Show File Location
Opens the file location where the XML files for the graph layouts are stored.
Graph Navigation
Navigating from the Graph
Navigate Frames (Alt + Left-click + Drag)
Alt + left-click on the graph and drag the mouse left and right to navigate through the recorded frames. You can do the same with the mouse scroll wheel as well.
Pan (Scroll-click + Drag)
Scroll-click and drag to pan the view vertically and horizontally throughout plotted graphs. Dragging the cursor left and right will pan the view along the horizontal axis for all of the graphs. When navigating vertically, scroll-click on a graph and drag up and down to pan vertically for the specific graph.
Zoom (Right-click + Drag)
Right-click and drag on a graph to free-form zoom in and out on both vertical and horizontal axis. If the Auto Extents Graph ![]() is enabled, the vertical axis range will be fixed according to the max and min value of the plotted data.
is enabled, the vertical axis range will be fixed according to the max and min value of the plotted data.
Select Frame Range (Left-click + Drag)
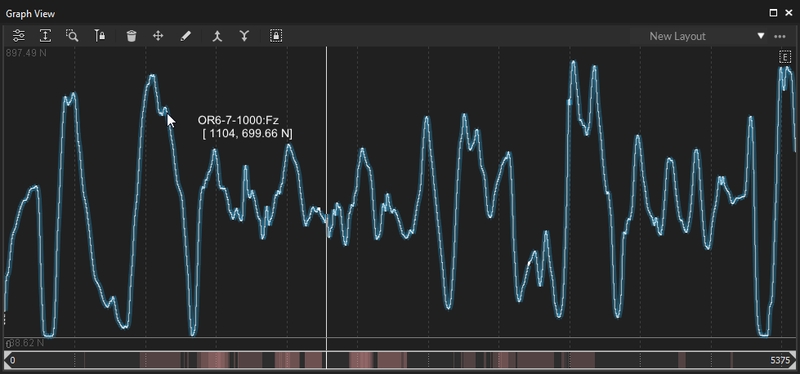
Frame range selection is used when making post-processing edits to specific ranges of the recorded frames. Select a range by left-clicking and dragging the mouse left or right. The selected frame ranges are highlighted in yellow. You can also select more than one frame ranges by shift-selecting multiple ranges.
Navigation Bar
Navigate Frames (Left-click)
Left-click and drag on the navigation bar to scrub through the recorded frames. You can do the same with the mouse scroll as well.
Pan View Range
Scroll-click and drag to pan the view range range.
Frame Range Zoom
Zoom into a frame range by re-sizing the scope range using the navigation bar handles. You can also Alt + right-click on the graph to select a specific range to zoom to.


Working Range / Playback range
The working range (also called the playback range) is both the view range and the playback range of a corresponding Take in Edit mode. Only within the working frame range will recorded tracking data be played back and shown on the graphs. This range can also be used to output a specific frame range when exporting tracking data from Motive.
The working range can be set from different places:
In the navigation bar of the Graph View pane, drag the handles on the scrubber to set the working range.
Use the navigation controls on the Graph View pane to zoom in or zoom out on the frame ranges to set the working range.
The working range can also be set from the Control Deck when in the Edit mode.
Selection Range
The selection range is used to apply post-processing edits only onto a specific frame range of a Take. Selected frame range will be highlighted in yellow on both the Graph View pane and the Timeline in the Control Deck.
Gap indication
When playing back a recorded capture, the red shading on the navigation bar indicates the number of occlusions from labeled markers. Brighter red means that there are more markers with labeling gaps in that section.
Frame Range Selection
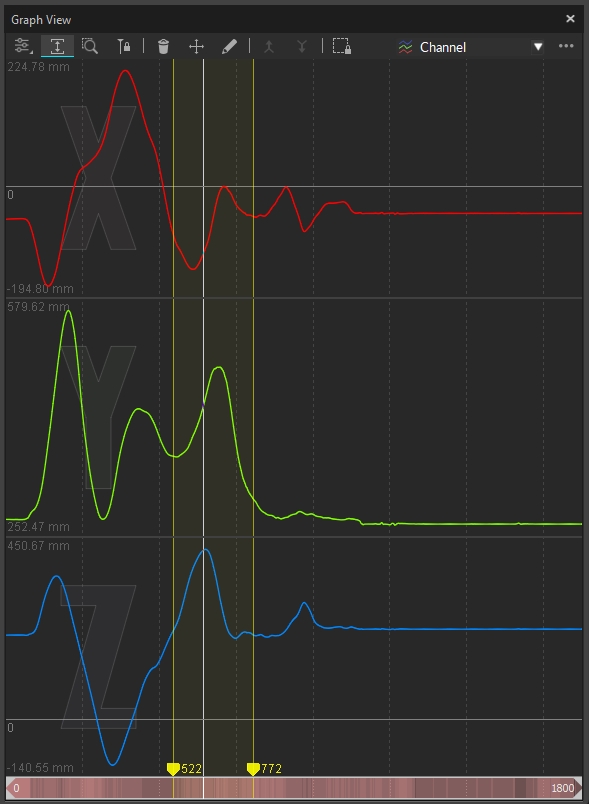
Left-click and drag over the graph to select a specific frame range. Frame range selection are used in the following workflows:
Zooming: Zoom to the selected range by clicking on the
 button or by using the F hotkey.
Tracking Data Export: Restrict exported tracking data to the selected range for easier analysis.
Reconstruction: Focus on a specific frame range during the post-processing reconstruction pipeline (Reconstructing / Reconstruct and Auto-labeling).
Labeling: Assign or modify marker labels, or run the auto-label pipeline on selected ranges only.
Post-processing data editing: Apply editing tools to the selected frame range only. Please see the Data Editing page for more detail.
Data Clean-up: Delete 3D data or marker labels on selected ranges.
Graph Context Menus
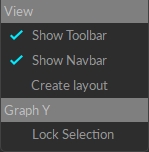
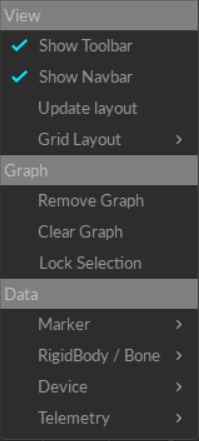
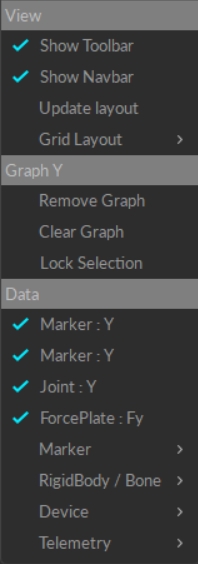
Right-click on any graph pane to open a Context menu with View options. From here, you can show or hide the Toolbar and Navbar, or create new layouts (covered in the Customize Graph Layout section, below).
Options are limited when using a System Layout. User-defined Layouts include more options, and will display the data included in the selected graph panel. This allows the user to quickly remove data from graph by unchecking the data type to remove it. Once removed, use the the Graph Editor Sidebar to add it again.
Layouts
The layouts feature allows users to organize and format graphs to suit their individual needs. The following layouts are available by default:
Channel
Combined
Tracks
Combined-primary
Force plates
Rigid body/bone
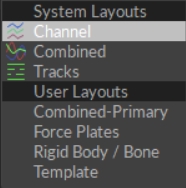
Users can also create and save custom layouts of up to 9 graphs each, specifying which data channels to plot on each graph. This section will focus on the system layouts and standard User Layouts. Please see the section Customize Graph Layout, below, for instructions to create custom graphs.
System Layouts
Commonly used layouts are available under System Layouts.
Channel View
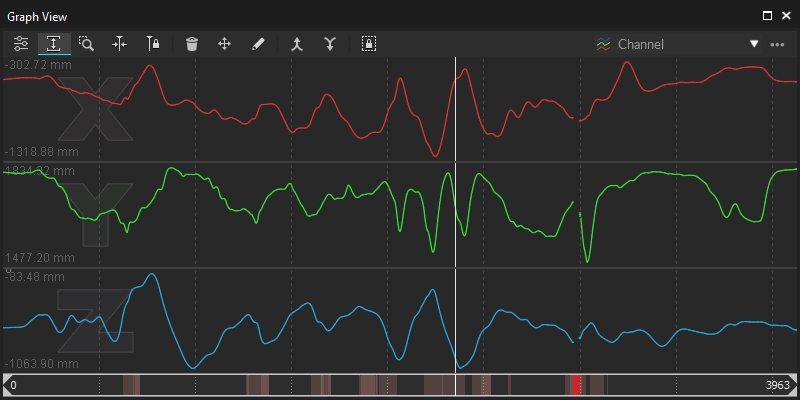
The Channel View provides X/Y/Z curves for each selected marker, providing verbose motion data that highlights gaps, spikes, or other types of noise in the data.
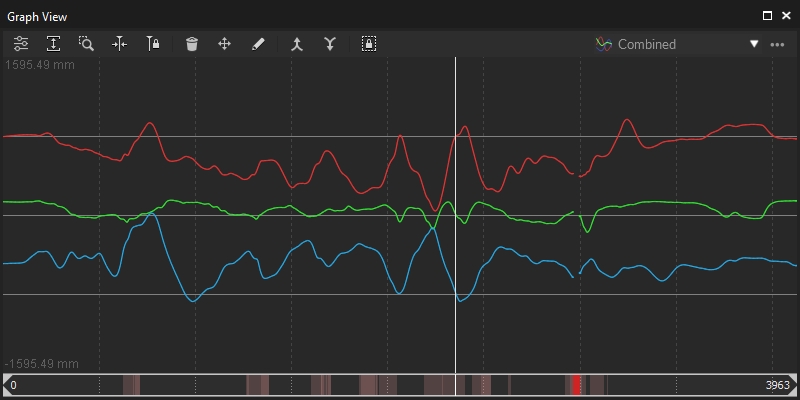
Combined View
The Combined View provides X/Y/Z curves for each selected marker at same plot. This mode is useful for monitoring positions changes without having to translate or rescale the y-axis of the graph.
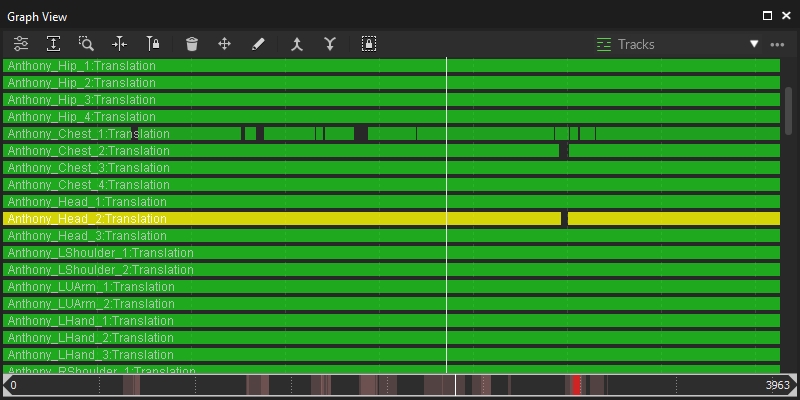
Tracks View
The Tracks View is a simplified view that can reveal gaps, marker swaps, and other basic labeling issues that can be quickly remedied by merging multiple marker trajectories together. You can select a specific group of markers from the drop-down menu. When two markers are selected, you can merge labels by using the Merge Keys Up ![]() and Merge Keys Down
and Merge Keys Down ![]() buttons.
buttons.
User Layouts
Combined-Primary View
The Combined-Primary view graphs the data in a single plot, similar to the Combined view, but this view only displays the data for the final marker selected (known as the Primary selection in Motive). Changes made to the data based on this view (e.g., filling gaps or smoothing ranges) will apply to all the selected markers, even those not displayed on the graph.
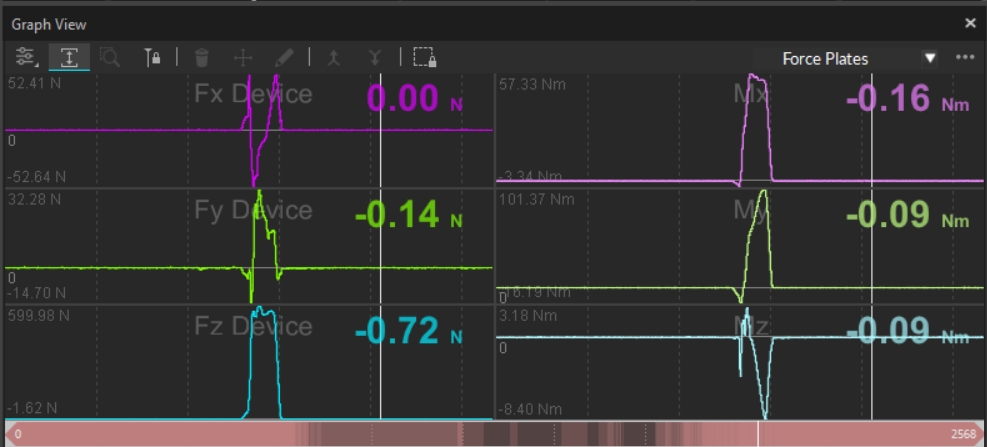
Force Plates View
The Force Plates View plots six variables for the selected Force Plate: Ground Reaction Forces on the left (Fx/Fy/Fz) and Rotational moments (Mx/My/Mz) on the right.
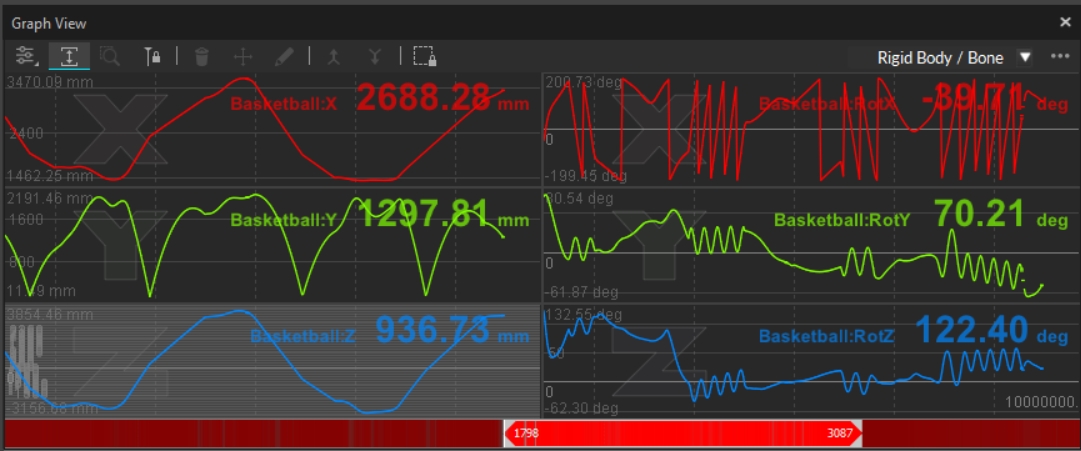
Rigid Body / Bone View
The Rigid Body / Bone View plots pivot point position (X/Y/Z), rotation (pitch/yaw/roll), or mean error values of the selected Rigid Body asset(s). Use the Lock Selection button to keep the graph locked to the selected asset(s).
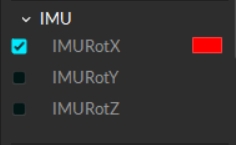
To add IMU data in the graph, click the ![]() Edit Graph button. On the Data tab, scroll to the IMU section and select the data you wish to plot.
Edit Graph button. On the Data tab, scroll to the IMU section and select the data you wish to plot.
Template View
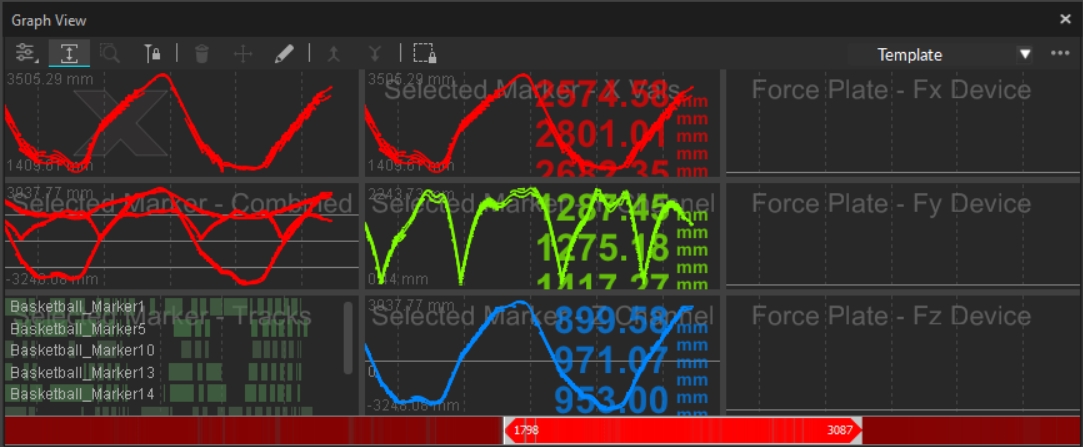
The template view is a nine-panel sample layout that includes a variety of graph options.
To replace any of the pre-set graphs, right-click in the panel with the graph you want to replace and select Clear Graph.
To remove a panel altogether, right-click and select Remove Graph.
If all three graphs in a column are removed, the remaining two columns will resize to fit the pane.
Click in any of the graph panels then click the ![]() Edit Graph button to select the data to plot in that panel. Click in another panel to select the data to plot there and continue these steps until all the data you wish to plot is selected.
Edit Graph button to select the data to plot in that panel. Click in another panel to select the data to plot there and continue these steps until all the data you wish to plot is selected.
Custom Layouts
The graph layout can be customized to monitor data from channels involved in a capture, as explained in the next section. Once a custom layout is created, it appears in the User Layouts section.
Customize Graph Layout
Custom layouts can serve as templates that require the user to make a selection in the 3D viewport, or they can be particularized to permanently lock the graph to a specific object or objects.
Step 1. Create New Layout
Select Create Graph Layout from the pane menu ![]() located on the top-right corner.
located on the top-right corner.
Step 2. Set the number of graphs
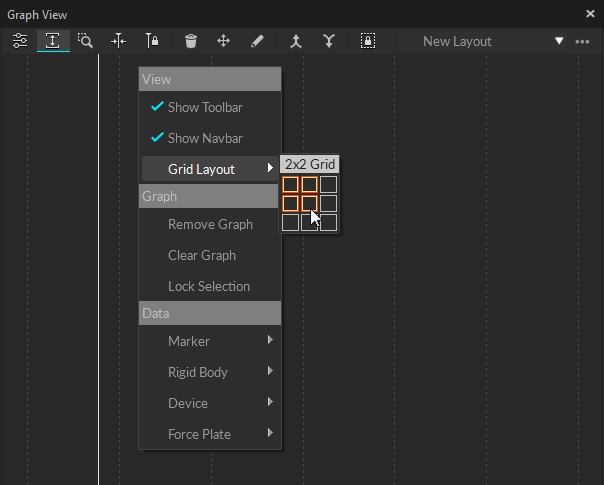
Right-click on the graph. Under Grid Layout, choose the number of rows and columns for the grid. The maximum allowed is 3 x 3.
Step 3. Open the Graph Editor
Expand the Graph Editor by clicking on the ![]() icon on the tool bar.
icon on the tool bar.
Step 4. Select a graph
Click on a graph from the grid to select it (it will appear highlighted). Edits made using the Graph Editor will apply only to the selected graph.
Step 5. Select Data Channels
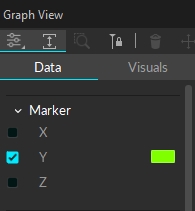
Next, check the data channels to plot from the Data tab of the Graph Editor. You can also change the color to use when plotting the corresponding data channel by clicking the color box to the right of the selection.
Step 6. Format visuals
Format the style of the graph using the Visuals tab. See the Visuals tab section below for more information the available settings.
Step 7. Repeat for each grid in the layout
Repeat steps 4 through 6 until each of the graphs in the layout is configured.
Step 8. Select the object to graph
Select one or more markers or assets (Rigid Bodies, Skeletons, force plates, or NI-DAQ channels) to monitor.
Step 9. Lock selection to graph(s)
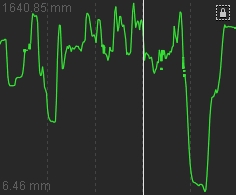
Lock the selection for any graphs that should stay linked to the current selection. Individual graphs can be locked from the context menu (right-click on the graph and select Lock Selection) or all graphs can be locked by clicking the ![]() button on the toolbar.
button on the toolbar.
Once all related graphs are locked, move on to next selection and lock the corresponding graph. Repeat as needed.
Step 11. Update the layout
When you have the layout configured with the selections locked, you can save the configurations as well as the implicit selections (i.e. what data to graph) temporarily to the layout. However, unless the layout is particularized to the explicit selections (i.e. the asset being graphed), you will need to select the items in Motive to plot the respective graphs each time you load the layout.
To update the layout, right-click in any of the graph panes and select Update Layout.
Particularizing a Layout
This action saves and explicitly fixes the selections that the graphs are locked to in an XML file. Once a layout has been particularized, you can re-open it in different sessions and plot the data channels from the same subject without locking the selection again. When the particularized layout is selected again, it looks for items in the Take (labeled markers, Rigid Bodies, Skeletons, force plates, or analog channels) with the same names as those contained in the particularized layout.
Click the ![]() button in the top right corner of the pane and select Particularize layout.
button in the top right corner of the pane and select Particularize layout.

Particularized graphs are indicated by an ![]() icon at the top-right corner of the graph.
icon at the top-right corner of the graph.
Preferred Layouts
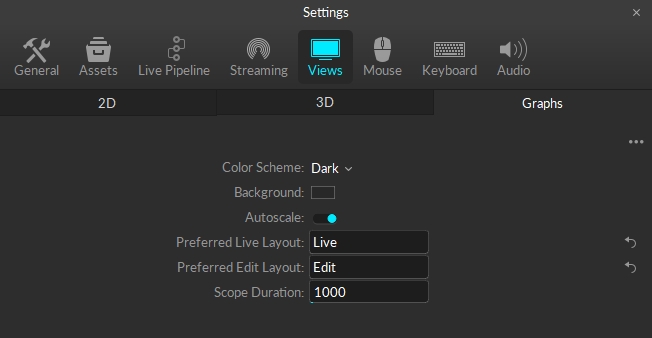
The Preferred Layout settings allow you to select graph defaults for both Live and Edit modes. These can be System layouts or custom layouts.
To select a layout:
Click the
 icon on the main toolbar to open the Settings panel.
 Click the Views settings.
On the Graphs tab, enter the name of the layout you wish to use exactly as it appears on the layout menu into the Preferred Live Layout and the Preferred Edit Layout fields.
Graph Editor
Use the Graph Editor to choose which data channels to plot (on the Data tab) and to format the overall look of the graph (from the Visuals tab).
When the Editor sidebar is expanded, one of the graph panes will change color to indicate the current selection. Changed made in the graph editor will apply only to this pane. After configuring the pane to your needs, left click in any other to change the selection. Continue until each pane is configured.
Navigation controls are disabled while the Graph Editor is open.
Open the Graph Editor by clicking the ![]() icon on the main toolbar.
icon on the main toolbar.
Data tab
The categories shown on the Data tab reflect the assets available in the Take or Live capture environment. Device, Force Plate, and IMU channels are shown only when such assets are present.
Only enabled, or checked, data channels will be plotted on the selected graph using the color specified. Once channels are enabled, one or more objects (marker, Rigid Body, Skeleton, force plate, or DAQ channel) must be selected (or locked) to display data in the graph.

Marker
Plot the 3D position (X/Y/Z) data of selected, or locked, marker(s) onto the selected graph.
Rigid Body / Bone
Plot pivot point position (X/Y/Z), rotation (pitch/yaw/roll), or mean error values of the selected Rigid Body or Skeleton asset(s) onto the selected graph. The asset must be solved.
Device
Plot analog data of selected analog channel(s) from a data acquisition (NI-DAQ) device onto the selected graph.
Force Plate
Plot force and moment (X/Y/Z) of selected force plate(s). The plotted graph respects the coordinate system of the force platforms (z-up).
IMU
Plot rotation (pitch/yaw/roll) values of the IMU in the selected Rigid Body, solved or unsolved.
Telemetry Graphs
Telemetry graphs provide information useful for monitoring performance of the Live system.
In Edit mode, the graph displays data from the original capture and is not affected by changes made to the Take in post production such as adding or deleting assets. This allows OptiTrack Support Engineers to observe system information from a recorded Take while troubleshooting issues that occurred during a capture.
Telemetry graphs can be selected from the Data tab of the Graph Editor or by right-clicking on a user layout and selecting Telemetry, which displays the menu shown below.
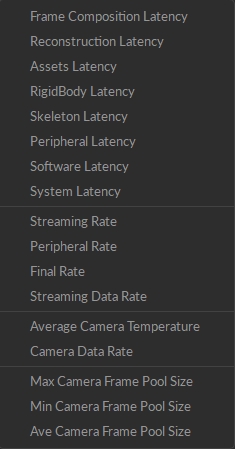
In Motive, latency values are measured, not calculated, resulting in precise and accurate values. See our Latency Measurements page for more information.
Reconstruction Latency
The point cloud reconstruction processing time (in ms).
RigidBody Latency
Rigid Body solving processing time (in ms).
Skeleton Latency
The cumulative solving processing time for skeleton and trained markerset (in ms).
Peripheral Latency
Peripheral device solving processing time (in ms).
Software Latency
Software pipeline processing time from synchronized camera frame group arrival time to data streaming out (measured, in ms).
System Latency
Total system processing time from camera mid-exposure to streaming out (measured, in ms.)
Streaming Rate
NatNet streaming data rate (frames/sec).
Peripheral Rate
Peripheral device sampling rate (frames/sec).
Final Rate
The calculated frame rate (frames/second).
Streaming Data Rate
NatNet per-frame streaming packet size (bytes/Mocap frame).
Average Camera Temperature
The average camera temperature as measured from each camera's temperature sensor (in degrees Celsius).
Camera Data Rate
The cumulative data rate for all cameras in the frame group for the selected frame (Measured in KBps/frame).
A frame group is the set of cameras that contribute data to the current frame. This may include all the cameras in the system, or a subset.
Max Camera Frame Pool Size
The largest allocated camera frame buffer (pool size) among all cameras (camera frames).
Min Camera Frame Pool Size
The smallest allocated camera frame buffer (pool size) among all cameras (camera frames).
Ave Camera Frame Pool Size
The average allocated camera frame buffer (pool size) among all cameras (camera frames).
Visual tab
The Visual tab has settings that affect the overall look and style of the graph. Like the settings on the Data tab, Visuals are set independently for each of the panels in the graph pane.
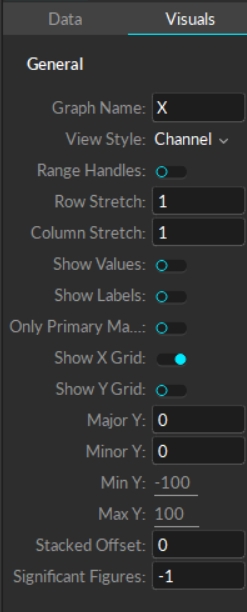
Graph Name
Labels the selected graph.
View Style
Configures the style of the selected graph:
Channel: Plots selected channels onto the graph.
Combined: Plots X/Y/Z curves for each selected markers fixed on the same plot.
Gap: Plots markers as tracks along the timeline to easily monitor and fix occluded gaps on selected markers.
Range Handles
Enables or disables the range handles located at the bottom of the frame selection.
Row Stretch
Sets the height of the selected row in the layout. The height is determined by a ratio to a sum of all stretch values:
(row stretch value for the selected row)/(sum of row stretch values from all rows) * (size of the pane).
Column Stretch
Sets the width of the selected column in the layout. The width size is determined by a ratio to a sum of all values:
(column stretch value for the selected column)/(sum of column stretch values from all columns) * (size of the pane).
Show Values
Displays the current frame values for each data set.
Show Labels
Displays the name of each plotted data set.
Only Primary Marker
Plots data from the primary selection only. The primary selection is the last item selected in the Assets pane or the 3D Viewport.
Show X Grid
Shows or hides the x gridlines.
Show Y Grid
Shows or hides the y gridlines.
Major Y
Sets the size of the major grid lines, or tick marks, on the y-axis values.
Minor Y
Sets the size of the minor grid lines, or tick marks, on the y-axis values.
Min Y
Sets the minimum value for the y-axis on the graph.
Max Y
Sets the maximum value for the y-axis on the graph.
Stacked Offset
Creates vertical distance between the plotted points when tracking multiple markers or assets in a single graph.
Significant Figures
Sets the number of decimal places to show in the graph values. The default value of -1 will show 2 decimal places. Set the value to 0 to round to the nearest whole number.
Was this helpful?

